Python Course for Beginners
Python Syntax
Welcome to the world of Python programming! In this chapter, we’ll embark on a journey to explore the basics of Python syntax. Python, known for its simplicity and readability, is a great language to start your programming adventure. Let’s dive in and learn through a story - the tale of Alice in DataLand.
Basics of a Python Script
In DataLand, everything starts with a script. A Python script is like a recipe that tells your computer what to do. Each line of the script is an instruction, a step in the recipe, that the Python interpreter reads and executes.
# This is a simple Python script
print("Hello, DataLand!")

# Now let us is another simple script, which Calculates the area of a Triangle
# If you run this script as it is, python may hiss at you (in form of some errors)
# This will be more clear in the end of the section about variables

area = 0.5 * base * height
The script (also called codes sometimes) in Python are read and executed from top to bottom, in an orderly fashion. The output of earlier script can be used in the upcoming lines. In the example above, we saw a simple script used to print text of our choice on the screen. We will write many more going forward.
Before we move forward, two very important points about Pyhton-
- Python is case sensitive. Therefore,
print()andPRINT()are different, so isPrint(). - Python is cute 😊. You are going to love it.
Variables: Holding Data
Alice starts her day in DataLand by collecting data. In Python, we store data in containers called variables.
name = "Alice"
age = 10
height = 4.5
Here, name holds a string “Alice”, age holds an integer 10, and height holds a float 4.5.
You can call a variable by its name, and the value it holds will come as the output. We will use variables to do operations on them, and they will behave exactly as the value they hold.
example:
# Guess the output for_fun
for_fun = age + height
Now call the variable, for_fun, and see what value it returns. Ohh, I forgot to tell you how to call a variable. Just write its name and run the code.
The variables are sensitive creatures. Particularly they are very touchy about their names. Therefore, there are few very important points you must be careful about, when you name a variable. Here’s a summary of these rules:
Rules for Naming Variables in Python
-
Alphanumeric and Underscore: Variable names must consist of letters (a-z, A-Z), digits (0-9), or underscores (_). However, they cannot start with a digit.
-
Case Sensitivity: Variable names are case-sensitive. This means that
myVariable,myvariable, andMyVariableare all considered different variables in Python. -
No Reserved Words: Variable names cannot be the same as reserved words (also known as keywords) in Python. Reserved words are those that have a special meaning in Python syntax (e.g.,
if,for,while,class,import,return,def,try, etc.). -
No Special Characters: Apart from the underscore, any other special characters (like @, #, %, &, etc.) are not allowed in variable names.
-
Not Starting with an Underscore (Convention): While it’s allowed, it’s a convention not to start a variable name with an underscore, as these are often used for specific purposes (like indicating a variable is for internal use, or for naming methods in classes).
Best Practices and Conventions
Beyond these rules, there are also some best practices and naming conventions in Python:
-
Descriptive Names: Choose meaningful and descriptive names for variables. For example,
priceis better thanp, anduser_ageis better thanua. -
Snake Case for Variables: Python community prefers snake_case for variable names where words are lowercase and separated by underscores, e.g.,
my_variable. -
Avoid Using Single Character: Except for certain cases like loop indices or lambda functions, avoid using single characters like
x,y,i. -
Constants: By convention, constants are defined using uppercase letters with underscores separating words, e.g.,
MAX_SIZE.
Following these rules and conventions ensures that your Python code is more readable, maintainable, and less prone to errors. Now when we have learnt all about the variables in Python, let us go back to calculating the Area of Triangle.
To write a simple script to calculate the area of a triangle, you can use the formula:
$\text{Area} = \frac{1}{2} \times \text{base} \times \text{height}$
Here is a Python script that prompts the user to enter the base and height of the triangle and then calculates and prints the area:
# Python script to calculate the area of a triangle

# Input base and height of the triangle
base = float(input("Enter the base of the triangle: "))
height = float(input("Enter the height of the triangle: "))

# Calculate the area
area = 0.5 * base * height

# Display the area
print(f"The area of the triangle is {area}")
This script works as follows:
- It asks the user to input the base and height of the triangle.
- The inputs are converted to
floatto handle decimal values. - The area is calculated using the formula.
- Finally, it prints out the area of the triangle.
In the scripts or rather along with the scripts, we used some instructions and clarifications which started very conspicuously with a #. These are called comments in Python. Let us understand what is that now.
Comments: Notes to Self
As Alice collects data, she takes notes. In Python, we write notes using comments. Comments start with a # and are ignored by Python. They’re for humans, not machines.
# This is a comment
# Python will ignore this
Therefore, whenever you want to write something which you want only humans to read (and therefore not being executed by the python interpreter), write them as comments. Going forward, you will notice many statements will be written which start with #. These are to make the code more readable and easy to understand. These lines will be ignored by the python interpreter.
Data and Operations in Python
Data Types: Strings, Integers, and Floats
As Alice wandered through the vibrant markets of DataLand, she marveled at the versatility of Data. They were like chameleons, changing forms effortlessly. Sometimes, Data appeared as simple numbers, like the cheerful 42 or the floating 3.14, known in the land as Integers and Floats. Other times, they transformed into sequences of letters and words, like "Hello, DataLand!", weaving tales as Strings. In DataLand, data comes in different types:
- Strings: Textual data, wrapped in quotes. Quotes can be single quotes, or double. Both are same.
- Integers: Whole numbers, without a decimal point.
- Floats: Numbers with a decimal point.
# String
favorite_book = "DataLand Adventures"
favourite_language = 'Python'
# Integer
chapters = 5
# Float
rating = 4.7
Basic Operations
In the bustling town square, Alice observed the wizards known as Operations. They were the dynamic force, performing actions that kept the land lively and functional.
Among them were the Arithmetic Operators, the most straightforward magicians, who helped villagers with their daily tasks - adding their coins with +, sharing their pies with /, or sometimes multiplying their harvest with *.
Alice loves to play with numbers. Python makes it fun with arithmetic operations.
- Addition (
+): Adds two numbers. - Subtraction (
-): Subtracts one number from another. - Multiplication (
*): Multiplies two numbers. - Division (
/): Divides one number by another.
# Arithmetic operations
sum = 7 + 3  # 10
difference = 7 - 3  # 4
product = 7 * 3  # 21
quotient = 7 / 3  # 2.333...
Then there were the Comparison Operators, the wise old judges of DataLand, who decided which number was greater with > and which was lesser with <, or sometimes just determined equality with ==. Alice also compares data using comparison operations. These judges passed their judgement in only two words, True or False.
- Equal to (
==): Checks if two values are equal. - Not equal to (
!=): Checks if two values are not equal. - Greater than (
>), less than (<), greater than or equal to (>=), less than or equal to (<=).
# Comparison operations
is_equal = (7 == 3)  # False
not_equal = (7 != 3)  # True
greater_than = (7 > 3)  # True
But the real enchantment happened when the Assignment Operators stepped in, often seen binding a value to a name with =, or mysteriously increasing a value with +=, subtly altering the events in DataLand. This is what we saw in assigning values to the variable names in previous sections.
# Binding a value to a name
magic_number = 7
alice_age = 12
wonderland_location = "Through the Looking Glass"
In these lines, magic_number is given the value 7, alice_age is set to 12, and wonderland_location is named "Through the Looking Glass". The name is always on the left of the assignement operator, and the value on the right. In Python, = is only for assignemnt, and thus == becomes the operator of equality.
And thn there is Increment Assignment (+=). The += operator is like a magical increment, adding more to what already exists, making things grow mysteriously.
# Increasing a value mysteriously
treasure_count = 10
treasure_count += 5  # Now treasure_count is 15

steps_to_castle = 100
steps_to_castle += 20  # Now steps_to_castle is 120
Here, treasure_count starts at 10 and mysteriously grows to 15 after encountering += 5. Similarly, steps_to_castle increases from 100 to 120.
And that concludes our first day in DataLand with Alice. Today, we learned about the basics of Python syntax, including how to write a script, use variables, make comments, understand data types, and perform basic operations. Stay tuned for more adventures as we delve deeper into the wonderful world of Python programming!
Control Structures in DataLand
As Alice continues her journey in the mystical DataLand, she learns to control the flow of her adventures. In Python, just like in any thrilling tale, the path isn’t always straight. Sometimes, decisions must be made, and paths must be repeated. This is where control structures come in, guiding the course of our story.
If-Else Statements: Choosing Paths
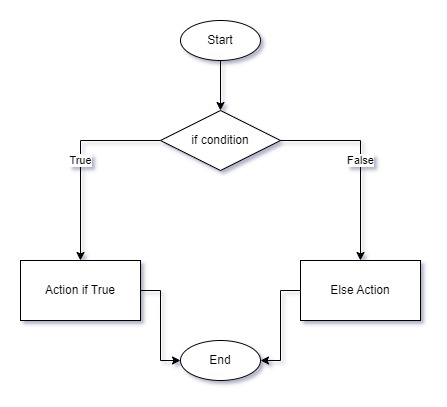
In DataLand, Alice often encounters crossroads where she must make choices. In Python, we use if-else statements to make decisions.
# If-Else Example
magic_number = 7

if magic_number > 5:
    print("The number is greater than 5")
else:
    print("The number is 5 or less")
Here, if the magic_number is greater than 5, Alice takes one path; otherwise, she takes another.
For Loops: Repeating Adventures
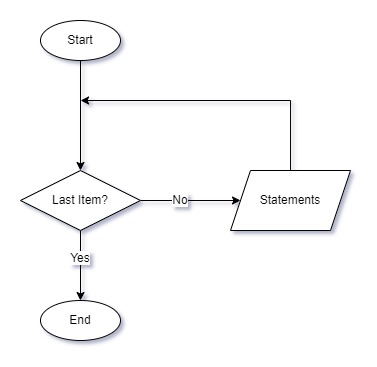
Sometimes, Alice likes to visit every house in a village. In Python, we use for loops to repeat actions.
# For Loop Example
for house_number in range(1, 6):  # This will repeat for house numbers 1 to 5
    print(f"Visiting house number {house_number}")
This loop helps Alice visit houses numbered from 1 to 5, one after the other.
While Loops: Continuing Until
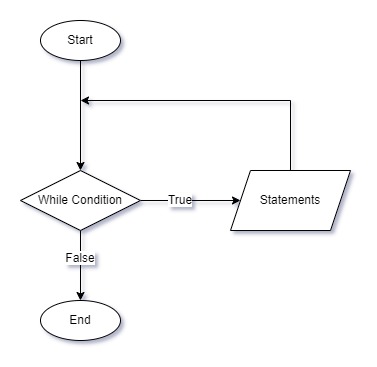
In some parts of DataLand, Alice walks through a forest until she finds a river. In Python, this is like a while loop, where we continue doing something until a condition is met.
# While Loop Example
steps_taken = 0

while steps_taken < 10:
    print("Walking...")
    steps_taken += 1  # Alice takes a step

print("Alice found the river!")
Here, Alice keeps walking (repeating the loop) until she has taken 10 steps.
In this chapter of “The tale of Alice in DataLand”, Alice learned to make decisions at crossroads with if-else statements, repeat her visits to the village houses with for loops, and continue her walk in the forest with while loops. Control structures like these are crucial in guiding the flow of any story, or code, in DataLand. Join us in the next section as Alice discovers more magical elements of Python programming!
Data Structures in DataLand
In the enchanting world of DataLand, Alice discovers the need to organize her findings. Much like arranging her thoughts and discoveries, Python uses data structures to efficiently store and manage data. Let’s follow Alice as she explores two of Python’s most versatile data structures: Lists and Dictionaries.
Lists: The Magical Wallet
Imagine Alice has a magical wallet with slots inbuilt. The slots can hold an assortment of items in a specific order. In Python, this wallet is called a list.
# Creating a list
treasures = ["Golden Key", "Mystic Scroll", "Potion of Light"]

# Accessing list elements
first_treasure = treasures[0]  # "Golden Key"
second_treasure = treasures[1]  # "Mystic Scroll"

# Adding an item to the list
treasures.append("Enchanted Gem")
Lists are perfect for when Alice needs to keep items in a particular sequence and access them later.
Dictionaries: The Book of Secrets
In DataLand, Alice comes across a magical book where she can record information with a name (also called key) and its details (also called value). This is like a dictionary in Python.
# Creating a dictionary
spell_book = {
    "Fireball": "A spell that conjures a ball of fire",
    "Heal": "A spell that heals wounds",
    "Invisibility": "A spell that makes you invisible"
}

# Accessing dictionary elements
fireball_description = spell_book["Fireball"]

# Adding a new spell to the dictionary
spell_book["Teleport"] = "A spell to transport you to different places"
Dictionaries are useful when Alice needs to retrieve information quickly without remembering the exact order, just the name(or the key).
In this section of “The tale of Alice in DataLand”, Alice learned about lists and dictionaries, two fundamental data structures in Python. She used lists to keep her treasures in order and dictionaries to record her spells with their descriptions. Understanding these structures is crucial for Alice as she prepares for more complex adventures in data manipulation and organization in Python.
# Creating a dictionary
spell_book = {
    "Fireball": "A spell that conjures a ball of fire",
    "Heal": "A spell that heals wounds",
    "Invisibility": "A spell that makes you invisible"
}

# Accessing dictionary elements
fireball_description = spell_book["Fireball"]

# Adding a new spell to the dictionary
spell_book["Teleport"] = "A spell to transport you to different places"

spell_book
{'Fireball': 'A spell that conjures a ball of fire',
 'Heal': 'A spell that heals wounds',
 'Invisibility': 'A spell that makes you invisible',
 'Teleport': 'A spell to transport you to different places'}
Functions - The Magic Spells of DataLand
As Alice delves deeper into the wonders of DataLand, she realizes the power of reusing her magic with ease. In Python, this magic is encapsulated in ‘functions’, which allow Alice to perform repeated tasks without rewriting the same code. Let’s follow Alice as she learns to craft and use these magical spells.
Crafting a Function: The Spell Creation
Think of a function as a spell recipe. It’s a set of instructions that Alice can call upon whenever she needs to perform a specific task.
# Defining a function
def greet(name):
    return f"Hello, {name}!"

# Using the function
greeting = greet("White Rabbit")
print(greeting)  # Outputs: Hello, White Rabbit!
Here, Alice creates a greet function that takes a name and returns a greeting.
Parameters: The Ingredients of Spells
In her spell recipes (functions), Alice uses ingredients (parameters). These are pieces of data she provides to her functions to customize their behavior.
# Function with multiple parameters
def mix_potion(ingredient1, ingredient2):
    return f"Potion mixed with {ingredient1} and {ingredient2}"

# Calling the function with parameters
potion = mix_potion("Dragon Scales", "Moon Dust")
print(potion)  # Outputs: Potion mixed with Dragon Scales and Moon Dust
Reusability: The Power of Functions
One of the most magical aspects of functions is their reusability. Alice can reuse the same function with different parameters, saving time and effort.
# Reusing the greet function
greet_alice = greet("Alice")
greet_rabbit = greet("Rabbit")

print(greet_alice)   # Outputs: Hello, Alice!
print(greet_rabbit)  # Outputs: Hello, Rabbit!
Default Parameters: Optional Ingredients
Sometimes, Alice wants to have default ingredients in her spells. In Python, these are called default parameters.
# Function with a default parameter
def cast_spell(spell="Invisibility"):
    return f"Spell cast: {spell}"

# Using the function with and without the default parameter
default_spell = cast_spell()
specific_spell = cast_spell("Fireball")

print(default_spell)    # Outputs: Spell cast: Invisibility
print(specific_spell)   # Outputs: Spell cast: Fireball
Conclusion
In this chapter of “The tale of Alice in DataLand”, Alice discovered the art of crafting and using functions, a fundamental aspect of Python programming. She learned to create reusable spells (functions) with various ingredients (parameters) and even optional ones (default parameters). With these new skills, Alice is now ready to embark on more efficient and organized adventures in DataLand. Alice continues to explore the enchanting world of Python programming!
Basic File Handling - The Chronicles of DataLand
In her adventures through DataLand, Alice discovers a library filled with ancient scrolls and books. These are much like files in Python, where data is stored and can be read or written. Let’s join Alice as she learns the art of handling these mystical files.
Opening a Book: Reading from a File
Alice finds a scroll named “Secrets_of_DataLand.txt”. To read its contents, she must first open it, much like opening a file in Python.
# Opening and reading from a file
with open("Secrets_of_DataLand.txt", "r") as file:
    content = file.read()
    print(content)
Here, Alice uses the with open statement to safely open the file. The "r" indicates she’s opening it in read mode. She then reads its contents and prints them.
Writing a Tale: Writing to a File
Inspired, Alice decides to write her own story. In Python, writing to a file is just as straightforward.
# Writing to a file
with open("Alice_Adventures.txt", "w") as file:
    file.write("Once upon a time in DataLand...")
In this example, Alice opens “Alice_Adventures.txt” in write mode ("w"). Anything she writes using file.write() will be saved in this file.
Appending to the Story: Adding to a File
Alice realizes she has more to add to her story. Instead of rewriting the whole scroll, she simply appends to it.
# Appending to a file
with open("Alice_Adventures.txt", "a") as file:
    file.write("\nAnd the adventure continues...")
By opening the file in append mode ("a"), Alice adds to the existing content without erasing anything.
Reading Line by Line: Discovering the Details
Sometimes, Alice prefers to read one line at a time, uncovering the story bit by bit.
# Reading a file line by line
with open("Secrets_of_DataLand.txt", "r") as file:
    for line in file:
        print(line, end='')
Here, Alice uses a for loop to read through “Secrets_of_DataLand.txt” line by line, revealing each line’s contents.
Conclusion
In this section of “The tale of Alice in DataLand”, Alice learned the crucial skills of reading from and writing to files, appending new content, and reading files line by line. These skills in file handling are essential for Alice’s journey through the vast and varied landscapes of DataLand, as they allow her to store and revisit her discoveries and tales. There are still many types of file formats which are used to store data, and can be easily handled by Python. We will learn about some of them in later sections, as for that we need to use Pandas package. Now package is a new word we introduced here, so lets learn more about them first.
Libraries and Package Management - The Alchemist’s Tools in DataLand
In her exploration of DataLand, Alice discovers an alchemist’s shop filled with an array of mystical tools and ingredients. These are akin to libraries and packages in Python, offering pre-written code for a multitude of tasks. Alice learns that to harness these powerful tools, she must first understand how to acquire and use them.
The Magic of pip: Acquiring New Spells
The alchemist introduces Alice to a magical command called pip, a tool that helps her add new spells (packages) to her collection. With pip, Alice can easily install, update, and remove Python packages.
pip is Python’s trusted package manager, which gets installed when we install Python, or Anaconda. To use pip, one needs to run the bewlo codes in anaconda terminal, or your computer’s terminal, or even inside a Jupyter notebook or Integrated Developement Environment (IDE) like VSCode or PyCharm.
# Installing a package with pip
pip install pandas
With this simple incantation, Alice installs the ‘pandas’ package, a powerful tool for data manipulation.
Importing a Library: Summoning the Magic
Once a package is installed, Alice learns to summon its magic using the import statement. This is like opening a book of spells and getting ready to cast them.
# Importing a library
import pandas as pd
By importing ‘pandas’ and naming it ‘pd’, Alice can now use its powerful data manipulation spells.
Using Library Functions: Casting the Spells
Now that Alice has her spells ready, it’s time to cast them. Each library comes with its own set of functions, much like specific spells in a spellbook.
# Using a function from pandas
data = pd.read_csv("adventures.csv")
Here, Alice uses the read_csv function from ‘pandas’ to read data from a CSV file, turning it into a format she can easily work with.
Exploring the Library: Understanding the Spellbook
Curious, Alice wants to know more about the spells she has. In Python, she can explore the documentation to understand her new tools better.
# Exploring a library's documentation
help(pd)
By using the help function, Alice can read about the functionalities and uses of ‘pandas’, learning how to better utilize its magic.
Conclusion
In this chapter of “The tale of Alice in DataLand”, Alice discovered the alchemist’s shop of libraries and package management. She learned how to use pip to install new packages, how to import libraries, use their functions, and explore their documentation. These new skills equip her with a vast array of magical tools, enhancing her journey through the mystical world of Python programming. Join us in the next chapter as Alice continues to weave her way through the enchanting realms of DataLand with her newfound knowledge.
NumPy - The Array Wizardry of DataLand
As Alice wanders through the mystical forests of DataLand, she stumbles upon an ancient temple inscribed with the symbol Νυ. This is the temple of NumPy, a powerful library known for its array wizardry and numerical incantations. Eager to learn, Alice steps inside to discover the secrets of NumPy.
Summoning NumPy: The First Spell
Before Alice can unleash the power of NumPy, she needs to summon it into her Python working environment.
# Importing the NumPy library
import numpy as np
By importing NumPy as np, Alice brings forth a treasure trove of numerical spells and array manipulations.
Arrays: The Heart of NumPy
In the center of the temple, Alice finds scrolls describing the core of NumPy – arrays. Unlike lists in Python, NumPy arrays are more powerful for numerical operations.
# Creating a NumPy array
magic_numbers = np.array([1, 2, 3, 4, 5])
With this simple array, Alice can perform complex numerical rituals effortlessly.
Array Operations: Casting Numerical Spells
Alice learns that with NumPy arrays, she can perform magical operations that are difficult with regular Python lists.
# Basic operations with NumPy arrays
doubled_numbers = magic_numbers * 2
sum_of_numbers = np.sum(magic_numbers)
Here, doubled_numbers will contain each element of magic_numbers multiplied by 2, and sum_of_numbers will hold the sum of all elements.
Multidimensional Arrays: The Labyrinths of Data
The temple’s walls depict the mysteries of multidimensional arrays, allowing Alice to store data in more than one dimension.
# Creating a 2D NumPy array
magic_matrix = np.array([[1, 2], [3, 4], [5, 6]])
With this, Alice can navigate through data labyrinths, accessing and manipulating complex data structures.
Array Slicing: Extracting Secrets
NumPy teaches Alice the art of slicing arrays, a technique to extract portions of her data.
# Slicing a NumPy array
first_row = magic_matrix[0, :]  # First row
first_column = magic_matrix[:, 0]  # First column
Array slicing allows Alice to focus on specific elements of her multidimensional arrays, revealing hidden patterns and secrets.
Conclusion
In this section of “The tale of Alice in DataLand”, Alice unlocked the mystical powers of NumPy, mastering arrays, numerical operations, and the art of slicing through multidimensional data. Equipped with these new skills, Alice is now prepared to tackle more complex challenges and weave even more intricate spells in the world of Python programming. Join us in the next chapter as Alice continues her magical journey through DataLand, armed with the wizardry of NumPy.
Pandas - The Data Enchanter of DataLand
After mastering the array wizardry of NumPy, Alice hears whispers of another powerful ally in the land of Python - Pandas. Known as the Data Enchanter, Pandas offers spells for sophisticated data manipulation and analysis. Eager to harness its power, Alice sets forth on her quest to explore the wonders of Pandas.
Summoning Pandas: The First Enchantment
To begin her journey with Pandas, Alice must first summon this mystical library into her world of Python.
# Importing the Pandas library
import pandas as pd
By importing Pandas as pd, Alice unlocks a realm filled with powerful tools for data handling.
DataFrames: The Magic Scrolls of Pandas
At the heart of Pandas lies the DataFrame - a magical scroll where data is arranged in rows and columns, much like a table in a grand library.
# Creating a DataFrame
adventures_data = {
    "Location": ["Forest", "Desert", "Mountain"],
    "Difficulty": [3, 7, 5],
    "Treasures": [10, 15, 5]
}
adventures_df = pd.DataFrame(adventures_data)
With this DataFrame, Alice can organize her adventures in DataLand, making the data easy to explore and analyze.
Reading Mystical Scrolls: Importing Data
Alice learns that Pandas is adept at reading data from various sources, like CSV files - the common scrolls of data storage.
# Reading data from a CSV file
enchanted_forest_data = pd.read_csv("enchanted_forest.csv")
This spell allows Alice to quickly read and analyze large volumes of data from her adventures.
Exploring Data: The Insightful Glance
With Pandas, Alice can easily explore her data, gaining insights that guide her future quests.
# Exploring the DataFrame
first_five_rows = adventures_df.head()  # Viewing the first five rows
summary_stats = adventures_df.describe()  # Summary statistics
These enchantments provide Alice with a quick overview and statistical summary of her data.
Manipulating Data: The Alchemist’s Touch
Pandas also teaches Alice how to transform her data, like an alchemist turning lead into gold.
# Adding a new column
adventures_df["Risk"] = adventures_df["Difficulty"] * 2
This spell adds a new column ‘Risk’ to her DataFrame, enhancing her understanding of each adventure’s perils.
Conclusion
In this chapter of “The tale of Alice in DataLand”, Alice discovered the enchanting powers of Pandas, learning to create and manipulate DataFrames, read data from various sources, and gain valuable insights from her adventures. With Pandas as her guide, she’s now ready to delve deeper into the realms of data analysis and visualization in the magical world of Python programming. Stay tuned as Alice’s journey in DataLand continues, armed with the enchanting prowess of Pandas.
Matplotlib Basics - The Art of Visualization in DataLand
With her new friends, NumPy and Pandas, by her side, Alice now ventures into the colorful world of Matplotlib. This part of DataLand is where data turns into visual stories. Here, Alice learns to use Matplotlib, a powerful library for creating a wide array of graphs and plots.
Summoning Matplotlib: The Artist’s Palette
Before Alice can paint her data stories, she must first summon the Matplotlib library.
# Importing the Matplotlib library
import matplotlib.pyplot as plt
With this, Alice has access to an artist’s palette of plotting tools.
The Basic Plot: The Starting Line
Alice begins her artistic journey with a simple line plot. She decides to plot the difficulty of her adventures over time.
# Creating a line plot
time = [1, 2, 3, 4, 5]  # Time in days
difficulty = [3, 4, 5, 3, 4]  # Difficulty of adventures

plt.plot(time, difficulty)
plt.title("Adventure Difficulty Over Time")
plt.xlabel("Time (Days)")
plt.ylabel("Difficulty")
plt.show()
This plot helps Alice visualize how the difficulty of her adventures changes each day.
The Scatter Plot: Stars in the DataLand Sky
Next, Alice explores the scatter plot to visualize the relationship between two aspects of her journey - the number of treasures found and the risk involved.
# Creating a scatter plot
treasures = [10, 15, 5, 20, 25]
risk = [4, 7, 2, 5, 8]

plt.scatter(treasures, risk)
plt.title("Treasure vs Risk")
plt.xlabel("Number of Treasures")
plt.ylabel("Risk")
plt.show()
The scatter plot reveals patterns in her data, much like constellations in the night sky.
The Bar Chart: Visualizing Comparisons
Alice then creates a bar chart to compare the number of treasures found in different locations.
# Creating a bar chart
locations = ["Forest", "Desert", "Mountain"]
treasures = [10, 15, 5]

plt.bar(locations, treasures, color=['forestgreen', 'sandybrown', 'grey'])
plt.title("Treasures Found in Different Locations")
plt.xlabel("Location")
plt.ylabel("Number of Treasures")
plt.show()
This bar chart helps Alice see which locations are the most rewarding.
The Pie Chart: A Slice of DataLand
Finally, Alice wants to understand the proportion of time spent in each adventure type. She decides a pie chart is perfect for this.
# Creating a pie chart
activities = ["Exploring", "Battling", "Puzzle Solving"]
time_spent = [40, 30, 30]

plt.pie(time_spent, labels=activities, autopct='%1.1f%%', startangle=140)
plt.title("Time Spent on Different Activities")
plt.show()
The pie chart provides a clear visual representation of how her time is distributed.
Conclusion
In this chapter of “The tale of Alice in DataLand”, Alice learned the basics of Matplotlib, exploring line plots, scatter plots, bar charts, and pie charts. She discovered the joy of turning her data into visually appealing stories, gaining new insights along the way. As Alice continues her journey through the vibrant world of data visualization, she looks forward to sharing her tales in the most colorful ways possible. Join us in the next chapter as Alice further enhances her storytelling with advanced visualization techniques in DataLand.
Chapter: Seaborn Basics - The Enchanted Brush of DataLand
Having painted her data in various hues with Matplotlib, Alice hears about an even more magical tool in DataLand - Seaborn. Seaborn is known as the Enchanted Brush, built upon the foundations of Matplotlib but offering more elegance and simplicity for creating statistical graphics. Eager to explore its capabilities, Alice delves into the world of Seaborn.
Summoning Seaborn: The Enhanced Palette
To begin her journey with Seaborn, Alice must first summon this advanced library alongside Matplotlib.
# Importing Seaborn
import seaborn as sns
import matplotlib.pyplot as plt
By invoking Seaborn (sns), Alice unlocks a range of sophisticated plotting functions.
Stylish Plots: The Aesthetics of Seaborn
One of the first spells Alice discovers is the ability to create aesthetically pleasing plots with minimal effort. She decides to revisit her scatter plot, this time using Seaborn’s enchanted capabilities.
# Creating a scatter plot with Seaborn
sns.scatterplot(x=treasures, y=risk)
plt.title("Treasure vs Risk (Seaborn Magic)")
plt.xlabel("Number of Treasures")
plt.ylabel("Risk")
plt.show()
The result is a more elegant and informative scatter plot, created with a simple incantation.
The Magic of Hue: Adding a Dimension
Alice learns that with Seaborn, she can add another dimension to her plots using colors, a spell known as ‘hue’.
# Adding hue to a scatter plot
adventure_type = ["Exploring", "Battling", "Exploring", "Puzzle Solving", "Battling"]
sns.scatterplot(x=treasures, y=risk, hue=adventure_type)
plt.title("Treasure vs Risk by Adventure Type")
plt.show()
This enhancement allows Alice to visualize not just the relationship between two variables, but how they interact with a third category.
The Boxplot: Revealing Data Secrets
Next, Alice explores the boxplot, a powerful tool for understanding the distribution of her data.
# Creating a boxplot
sns.boxplot(x="Location", y="Treasures", data=adventures_df)
plt.title("Distribution of Treasures in Different Locations")
plt.show()
The boxplot shows Alice the range, median, and outliers in the number of treasures found in different locations.
Pair Plots: The Dance of Variables
Finally, Alice stumbles upon the pair plot, a spell that creates a matrix of relationships between multiple variables.
# Creating a pair plot
sns.pairplot(adventures_df)
plt.show()
With this spell, Alice can see how each aspect of her adventures relates to the others, providing a comprehensive overview.
Conclusion
In this chapter of “The tale of Alice in DataLand”, Alice discovered the enchanted world of Seaborn, learning to create more sophisticated and visually appealing plots. She explored the use of hue for added depth, the insightful boxplot, and the comprehensive pair plot. With Seaborn’s magic at her fingertips, Alice is now equipped to weave even more captivating visual stories from her data. Join us in the next chapter as Alice continues to enhance her storytelling prowess in the enchanting world of DataLand.
Data Visualization Principles - The Artful Wisdom of DataLand
After mastering the tools of Matplotlib and Seaborn, Alice discovers that wielding these tools with artful wisdom is crucial. In DataLand, as in the realm of data visualization, the way information is presented can tell very different stories. Alice learns about the underlying principles of data visualization, ensuring her visual tales are both enchanting and truthful.
Choosing the Right Plot: The Storyteller’s Decision
In the grand library of DataLand, Alice finds a book titled “The Storyteller’s Decision”. It teaches her that choosing the right kind of plot is crucial for effectively conveying her adventures.
- Line Plots are used for showing trends over time.
- Bar Charts are great for comparing categories.
- Scatter Plots reveal relationships between two variables.
- Pie Charts are best for showing proportions of a whole.
- Box Plots provide insights into the distribution of data.
The Palette of Color Theory: Painting with Purpose
Alice learns that colors are not just to make her plots look pretty, but to communicate and highlight important information.
- Contrasting Colors can be used to distinguish different data groups.
- Color Saturation can represent intensity or concentration.
- Sequential Color Schemes are good for showing a progression.
- Color Blindness Awareness is crucial for accessibility, ensuring all viewers can understand her visualizations.
Truthful Representations: The Ethical Spell
In the deepest chamber of the library, Alice discovers the Ethical Spell of Data Visualization. This teaches her the importance of representing data truthfully.
- Avoid Misleading Scales: Using non-zero baselines in bar charts or inappropriate scales can mislead the viewer.
- Keep It Simple: Overcomplicating a visualization can confuse the audience.
- Context is Key: Providing context helps the audience understand the full story.
- Check for Bias: Ensuring her data and its presentation are unbiased and representative.
Telling the Full Story: Beyond the Numbers
Alice understands that data visualization is not just about presenting numbers; it’s about telling a story. She learns to:
- Provide Clear Labels and Legends: Making sure her audience knows what each part of her visualization represents.
- Write Descriptive Titles and Captions: Guiding the audience through the story she’s telling.
- Use Annotations Wisely: Highlighting key points and insights.
Conclusion
In this chapter of “The tale of Alice in DataLand”, Alice learned the crucial principles of data visualization. She now knows that the power of her tools lies not just in their ability to create, but in how they are used to tell truthful, insightful, and accessible stories. Armed with these principles, Alice is ready to embark on a journey of responsible and effective storytelling through her visualizations. Join us as Alice continues to weave her tales, painting a picture of DataLand that is as honest as it is enchanting.